


Buy Parts
![]()
LED Zappelin'
An open source and versatile LED controller for arbitrary spectrum visual stimulation
and optogenetics during 2-photon imaging.
by M.J.Y. Zimmermann, A.M. Chagas, P. Bartel, S. Pop, L.L. Prieto Godino & T. Baden
This project was published in July 2020 in the journal HardwareX
This project is licensed under the GNU General Public License v3.0
The hardware is licensed under the CERN OHL v1.2
Two-photon (2P) microscopy is a cornerstone technique in neuroscience research, but combining this technology with spectrally arbitrary light stimulation can be challenging due to crosstalk between stimulation light and fluorescence detection. To overcome this limitation, we present a simple and low-cost electronic solution based on an ESP32 microcontroller and a TLC5947 LED driver to rapidly time-interleave stimulation and detection epochs during scans. Implemented for less than $100, our design can independently drive up to 24 arbitrary spectrum LEDs to meet user requirements. We demonstrate the utility of our stimulator for colour vision experiments on the in vivo tetrachromatic zebrafish retina and for optogenetic circuit mapping in Drosophila.
- An open and versatile LED controler
- A £100 DIY efficient stimulator
- A stimulator for visual neuroscience
- A stimulator for optogenetics
- A detailed assembly and instruction manual
- A step by step calibration script
- Repository Structure
Introduction
Combining 2P imaging with additional light stimulation – for example for visual stimulation or for driving optogenetic actuators – has remained challenging because the stimulation light can interfere with fluorescence detection. This can result in light artefacts in the image and/or may damage sensitive fluorescence detection equipment (e.g. photomultiplier tubes, PMTs).
A temporal separation between light stimulation and fluorescence detection, for example during the scan-retrace, can ameliorate these problems. This problem can be readily solved electronically, for example through use of a microcontroller.
Here, we present such a solution. Our system can line-synch up to 24 independent LED channels, and can be assembled from off-the-shelf components for substantially below $100. This provides for flexible options of spectrally diverse light stimulation during 2-photon scanning and comfortably provides sufficient power to drive standard optogenetics actuators such as CsChrimson.
Alongside, we also provided a custom 3D-printed casing, designed suggestions for optically combining LED banks using Thorlabs parts, and an alternative 3D-printed LED holder and microscope chamber. For software control, we provided custom Arduino scripts to flexibly programme stimulation protocols.

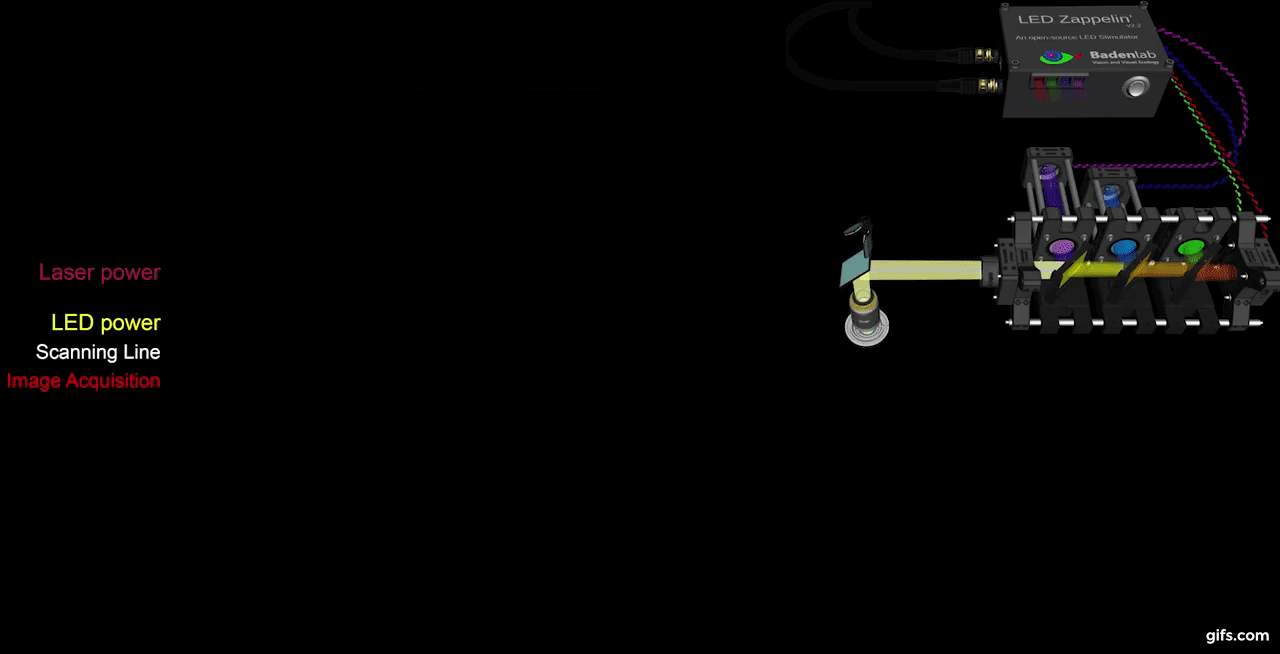
a) A fully assembled stimulator. b) Rendering of the custom-printed circuit board which accommodates the microcontroller, the LED driver and up to 24 LED channels. c) Schematics illustrating the circuit that controls the LED output. The blanking input can be inverted by a switch before reaching the output enable pin on the LED driver (electronically switching off the LEDs) and sending the signal to the micro-controller. A second switch control the blanking signal voltage as it needs to be adapted depending on the logic of the microcontroller used (3.3V for ESP32, 5V for Arduino). The microcontroller controls the LED driver through an SPI connection and send trigger signal output to an external. d) Illustration of the raster scan method described. The “blanking signal” is synchronous with the scanning logic, enabling the LEDs during the scanning mirrors retrace (black) and shutting them off during the acquisition (red), therefore providing temporal separation between stimulation and detection (Modified from (Euler et al. 2019)
The stimulator runs synchronous to the recording system using TTL triggers. TTL signals correspond to scanning mirror retrace periods and are used to turn ON and OFF LEDs, thus avoiding swamping the PMTs by stimulation light.
On the PCB, we incorporated a signal inverter which can be enabled through a jumper (see below) and that can modulated the TTL signal sign. This customisable option thus offers the possibility for a single design to be easily adapted to multiple imaging systems.

a) Oscilloscope reading of the blanking signal (blue) efficiently switching off an LED (yellow). The blanking is operated here without noticeable delay. b) Same as a), showing for a 1ms scanning cycle, the two possible configurations for the blanking signal input, with a low (top) and a high (bottom) blanking signal input respectively for an inverted and original signal input.
The use of a dedicated constant current LED driver tends to improve LED stability over time as well as its life span. Such driver ensures that the current drawn by the LED never leads to thermal runaways that might cause irreversible damage. This is particularly essential for short wavelength LEDs which tend to rapidly decay, thus necessitating regular recalibration or replacement.

a) Power recording of a 4 LED system using the TLC5947 (solid lines) and their expected brightness if directly controlled by a microcontroller (dashed lines). All LEDs have been set up to the same power (40nW), with equal max intensities values in the Arduino code. b) Same as a) but with LEDs set up at different max intensities in the Arduino code. Here the linearity of the LED intensity output remains constant.
Colour Vision Experiment
We used LED Zappelin' for studying the retinal processing of the tetrachromatic zebrafish retina in response to multichromatic signal. Here we selected four LEDs that match the peak sensitivities of each cone opsins of our model. We chose LEDs and band pass filters in such manner that the stimulating light and the detection bands do not overlap as much as possible. However a temporal separation is still necessary to avoid some overlapping and any light artifact.

We recorded light-driven calcium signals under 2-photon from retinal bipolar cells in vivo in the tetrachromatic larval zebrafish. We used a transgenic line expressing a genetically encoded biosensors for calcium at the bipolar cell synaptic terminals level (ctbp2:SyGCaMP6) within the inner plexiform layer (IPL).
Following established protocols, we used a Sutter MOM microscope where light stimulation is displayed through the objective directly onto the fish retina along with the laser excitation. Fluorescence is also collected through the objective as well as from below the stage (not shown).
We presented full field steps of red, green, blue and UV light to the fish eye (respectively 567, 480, 420 and 365nm), and recorded evoked calcium signals as a readout of synaptic activity. We observed spectrally different tunings from distinct bipolar cell terminals without detectable stimulus artefact across the scan.

a) Overview of the setup described for the visual stimulation experiment performed on the tetrachromatic zebrafish. b) Drawing of the larval zebrafish retina highlighting the IPL. c) 2 photon scan field of the IPL with regions-of-interest marked by red circles. The 64x32 pixel image was obtained by at 1ms scan rate. d) Ca²⁺ traces (mean traces in black, n=5 trials in grey) in response to consecutive red, green, blue and UV On/Off flashes. e) Trigger timing recorded by the DAQ highlighting its accuracy over time with a precision of 0.1µs. t(n+1) = t(n) + T, where “t” is the recorded trigger time and “T” the trigger period.
Optogenetics Experiment
In addition to colour vision experiments, LED Zappelin' is well suited for optogenetic manipulations.
Here we illustrate this application in Drosophila larvae, were we recorded brain-wide calcium signals under 2P in response to optogenetic stimulation of all olfactory sensory neurons (OSNs). We expressed the red-shifted channel rhodopsin CsChrimson OSNs and the genetically encoded calcium indicator GCaMP6s pan-neuronally by using larvae with the genotype: elav-Gal4;UAS-GCaMP6s/Orco-LexA;LexAOp-CsChrimson.
We placed first instar larvae under a custom-made 2P microscope in a 3D-printed optogenetics LED chamber. Red light stimulation was delivered from around the sides of the recording chamber and GCaMP6s fluorescence intensity was collected by two detectors one through the objective lens, and a sub-stage PMT. We presented full field illumination steps of 615 nm light lasting 0.5 s and an inter-stimulus interval of either 3 s (b) or 10 s (c).
We observed robust stimulus-evoked activity in the primary olfactory sensory centres of the larval brain, the antennal lobes (red outlines). Similarly to colour vision experiments, we detected no light artefact.

a) Schematic of a fruit fly first instar larval head expressing the red-shifted channel rhodopsin CsChrimson in olfactory sensory neurons and GCaMP6s in all neurons. b) Rendering of the experimental setup: The mounting chamber is placed in a 3D-printed holder, screwed onto a rigid stand (ThorLabs). c),d) 2 photon scan field of the larval brain with antennal lobes marked by red circles (left) and Ca²⁺ traces in response to red flashes (right). c. Stimulation duration = 0.5 s, inter-stimulus interval = 3 s, image dimensions = 256 x 230, scan rate = 1081 Hz, frame rate = 4.7 Hz. d) Stimulation duration = 0.5 s, inter-stimulus interval = 10 s, image dimensions = 256 x 170, scan rate = 1077Hz, frame rate = 6.34 Hz.
Repository structure
├───3D Designs Contains printed parts for the stimulator and optical components│ ├───Optical Components| | ├───STL renderings - Printing files| | └───SCAD files - SCAD files to be modified if need be│ ├───Optogenetics Components| | ├───STL renderings - Printing files| | └───SCAD files - SCAD files to be modified if need be│ └───Stimulator| ├───STL renderings - Printing files| └───SCAD files - SCAD files to be modified if need be|├───Arduino Code Stimulator Code| ├───Stimulator Code - Adaptable C+ code for running the stimulator| └───LED driver library - Library to run the TLC 5947|├───Bill of Materials List of necessary components and retailer suggestions|├───Datasheets - Contains all technical sheet for:| ├───Optical Components - ...LEDs, Filters, Dichroic Mirrors used in the presented example| ├───Stimulator - ...micro-controller and LED driver| └───Spectrometer - ...device used for calibration|├───Images Image repository|├───Instruction Manual Detailed manual to assemble and calibrate the stimulator| └───Stimulator Calibration - Contains calibration recordings and the adaptable jupyter notebook script to calibrate the stimulator| ├───Arduino Calibration Code - Sequence used for the calibration| ├───Calibration Figures - Illustration from calibration measurements| ├───Filters - Filters and dicroic mirrors spectra| ├───Powermeter Recording - Recording of the calibration sequence| ├───Spectrometer Recording - Recording of the calibration sequence| └───Stimulator Calibration - iPython Jupyter Notebook script for calibration|├───PCB KiCad and Gerber files to modified and generate PCB for:│ ├───Potentiometer mounts - ...trimmer potentiometers that set the LED maximum brightness│ └───Stimulator - ...the stimulator itself|└───References Publication used to design and conceive this model 